There is a tool that can be invaluable in the planning stages from college assignments to corporate market research. It’s Google Trends. If you want to see what’s going on in the market at a glance, you can do market research in less than 10 minutes with Google Trends. You can even code your findings and update them in real-time with Google Trends. Let’s take a look at how to use it.
First of all, Our review is based on the Google Trends service provided by Google Korea, which may differ from other regions.🤗
Explore & Real-Time Trending in Google Trends
Google Trends does not officially provide “real-time” search query service in South Korea. This is in line with the policy of removing real-time trending search services from Big tech Platfoms such as Naver and Daum. However, you can still see real-time trending searches for countries other than Korea.
Google Trends instead shows popular searches that are more than 24 hours old in Explore and Trending, so it’s a great way to get a sense of the big picture.
Direct Links
If you click the below link, it’ll be connected to Google Trends.
Feature 1: Explore
When you go to the Explore tab, you’ll automatically see search terms that have been trending for the past 30 days or more. It shows you 25 search topics and 25 search terms. Clicking on a keyword takes you to a graph of search terms over time and by region.
Feature 2: Real-time trending services
Daily Trending Searches shows results from one day ago. However, as a matter of policy, South Korea does not provide real-time trending search terms.
Analyze interest by time period and region
In Explore, you can see the change of search terms over time and the interest in sub-regions based on the search settings criteria (①the region ②time period ③search type, and ④ comparison terms). Press the download mark at the top of the graph to save it as a CSV file. This allows you to analyze big data through coding. You can also share the graph in HTML format.
Setting search criteria
① Search interest: it is represented by a numerical value from 0 to 100 on the y-axis of the graph. The highest search frequency will be 100, half the frequency will be 50, and 0 will be displayed if there is not enough data for that search term.
② The results: it will change depending on your search type settings, so the graph will look different. Region, time period, and category have a wide range, but search type is somewhat limited. This is because they are determined within the search services provided by Google (Web, Image, YouTube, News, and Google Shopping).
③ Search Type: You can enter up to four additional comparison search terms. They are displayed in multiple graphs with different colors over time and geography.
Result 1: Changes in search queries over time
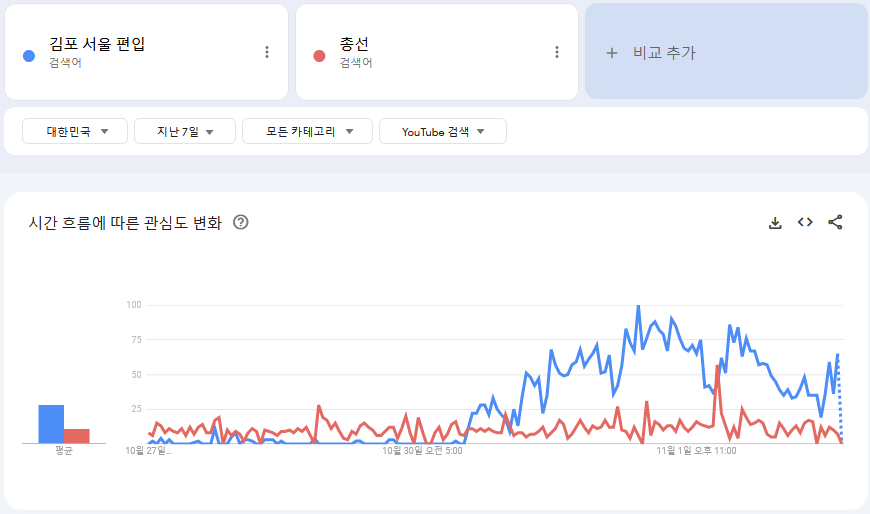
For instance, let’s look at a recent trending topic in South Korea, the city of Gimpo’s inclusion in Seoul, and compare it to search results for the general election. The search criteria are region (South Korea), time period (last 7 days), category (all categories), and search type (YouTube search). The results are shown below.
The graph changes as the news about Gimpo’s annexation to Seoul begins to pick up steam. In particular, the interest has risen sharply to 100 since October 30.
Result 2: Sub-regional interest
‘The search volume by province for “Gimpo city annexation to Seoul” and “general election” is displayed graphically on the map. Interest in the general election is surprisingly high in Gangwon Province and Jeju Island. In addition to sub-regions, you can also adjust by city – just replace ‘sub-region’ with ‘city’ at the top of the graph.
Closing thoughts
Google Trends is a great tool to get a feel for what’s going on in the market, especially if you integrate your data so you can update it daily. We recommend Google Trends for its versatility.